The price of power: why batteries are starting to look obvious
· Energy · 7 min read
German wholesale power averages €87/MWh — but at noon it's €36 and by 6 pm it's €143. A look at where the price actually comes from, hour by hour.
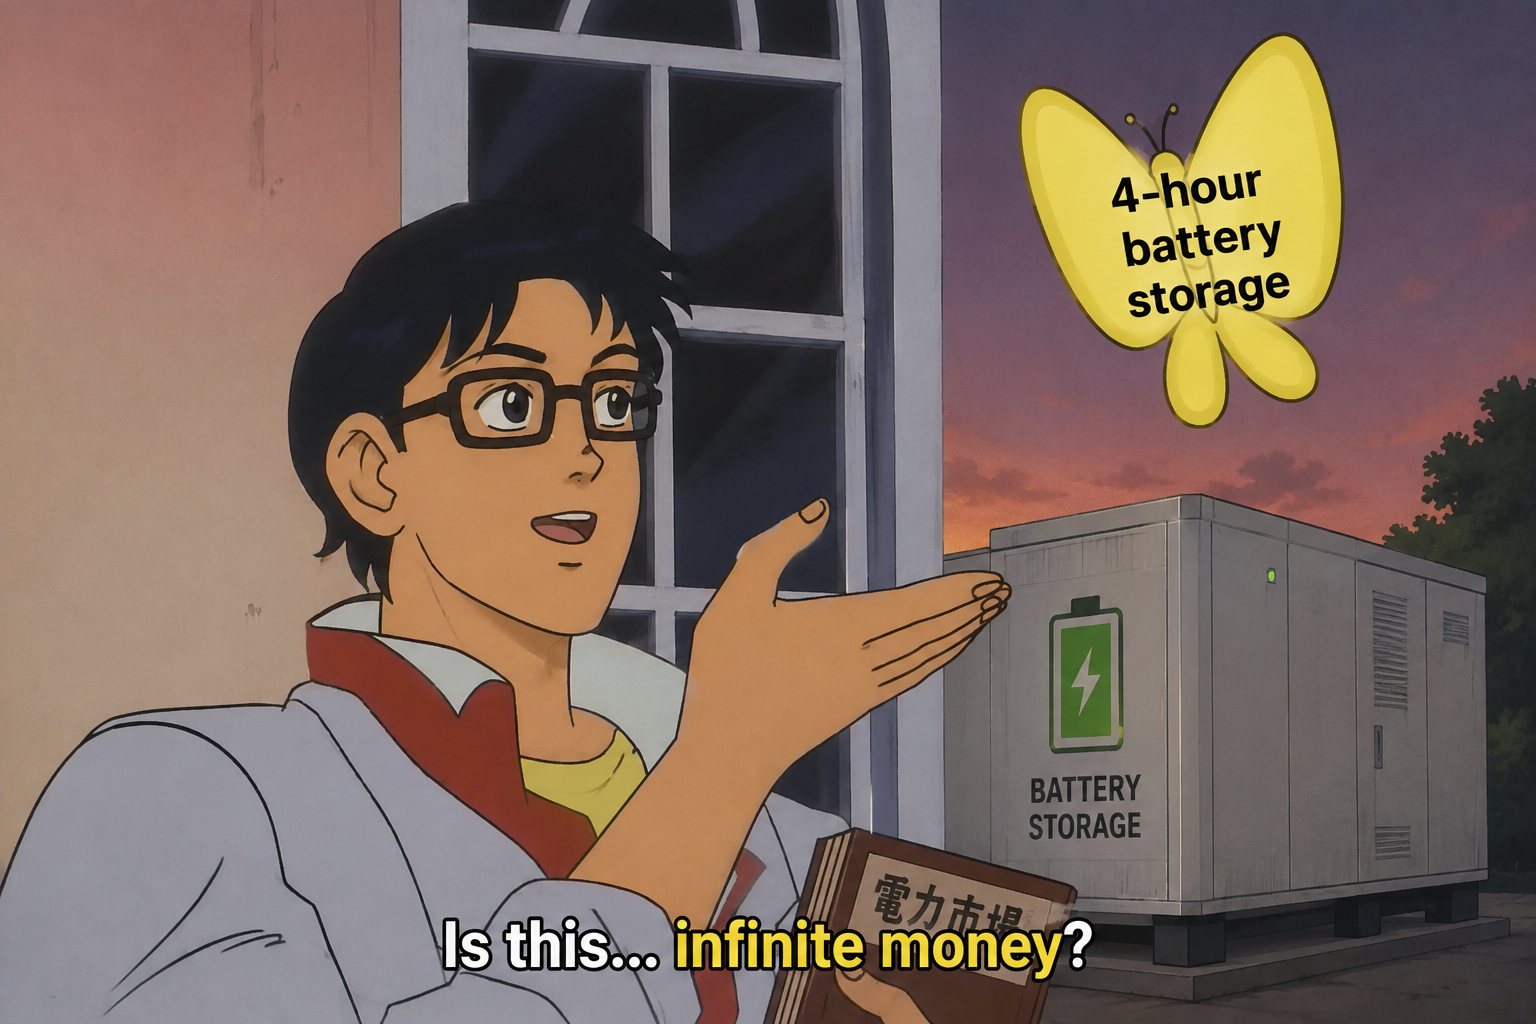
TL;DR. Solar drags the midday price down; pumped-hydro storage earns the highest capture price of any source by shifting energy noon→evening. That spread grew ~€15/MWh in the last year. Batteries can do what pumped-hydro does, without the mountain.
European power prices have stayed high for years now, even after gas prices came down and renewables kept growing. This article looks at the wholesale market; a follow-up will add taxes, grid fees, and the EEG levy to see how a final consumer bill is built up. Data comes from SMARD, the German regulator’s open-data portal: 15-minute generation and day-ahead prices for two consecutive years, resampled to hourly, used to compute the capture price (volume-weighted price each source actually earned) and the generation mix at each hour of the day. All charts below are interactive — hover any series for the underlying numbers.
A typical German day
Here is the average German day across the past year. Stacked bars show how many gigawatts each source produces at each hour. The black line is the average wholesale price.
The day has a clear shape:
- Total production peaks around noon at about 62 GW, then drops in the afternoon and rises again in the evening.
- Solar appears around 6 am, peaks at about 30 GW between 11 and 13, and is gone by 8 pm.
- The price line moves opposite to solar. It falls to roughly €36/MWh at noon and rises to about €143/MWh at 18:00.
The reason is how the wholesale market is cleared. Every hour, the cheapest plants are dispatched first, and the price is set by the most expensive plant still needed to meet demand. Solar has near-zero marginal cost, so when the sun is up it pushes more expensive plants out of the merit order. The plant that ends up setting the price at noon is often a coal or lignite unit. At 18:00, when solar is gone but demand is still high, that role is taken over by gas.
There is one detail in the chart worth pointing out separately. Pumped-hydro storage is the small pinkish band near the top of the stack. It is almost absent during the day, and it shows up exactly at the two evening hours when the price spikes. It pumps water uphill at noon, when power is cheapest, and runs the water back down through the turbines at 18:00 to 19:00, when the price is at its maximum. That is the entire pumped-hydro business model.
Capture price: what each source actually earns
To compare sources directly, I computed each source’s capture price: the volume-weighted average price it earned over the year. If a source generates a lot during cheap hours, its capture price is low. If it generates during expensive hours, its capture price is high.
A few observations:
- Pumped-hydro sits at the top of the chart almost every month, typically €110–150/MWh. That is higher than gas, coal, or lignite. Storage does not generate energy; it moves energy in time. The chart shows that moving energy from noon to evening is more valuable than producing it.
- Solar sits at the bottom and trends down. In April 2025 it captured around €32/MWh; by April 2026 it was at €23. Early May 2026 (only a few days of data) is negative.
- Gas, hard coal, and lignite cluster near the average price. They run when renewables cannot cover demand, which is also when the price is highest, so they earn close to the market average.
Note on what capture price means. Capture price is revenue per MWh, not cost. Gas’s capture price is close to its real fuel cost because gas usually sets the price when it runs. Solar’s underlying marginal cost is essentially zero, so its capture price tells you what it is paid, not what it costs. The difference between the two is the producer’s margin, and for solar that margin is shrinking.
In other words: in Germany, storage is currently the highest-earning source on the wholesale market, and solar is the lowest-earning source, even though only one of them is a power plant.
Year over year: the spread is widening
To check whether this is a pattern or a one-off, I ran the same analysis on the previous year (April 2024 to April 2025) and overlaid the two.
The midday price has dropped further. A year ago the noon floor was around €53/MWh; this year it is €36. The evening peaks have stayed roughly the same. So the spread between cheap solar hours and expensive evening hours grew by about €15/MWh in one year. Each euro of that spread is something a battery could earn by charging at noon and discharging in the evening.
Why did the midday floor fall? Plot every source as a single dot, with how much its production grew on the x-axis and how much its earnings changed on the y-axis:
Solar is alone in the bottom-right: it grew the most and got paid the least. The economics term is cannibalization — every new panel competes with every other panel during exactly the same midday hours, and pushes that hour’s price down. Wind grew almost as much without the same hit, because wind output is spread across the whole day rather than clustered in a six-hour window.
For solar specifically, this means new projects increasingly need a way to decouple generation from sale time to keep their economics working. That decoupling is exactly what storage does.
The arbitrage opportunity
The pattern in the data is consistent across the past two years and getting stronger:
- Solar pushes the midday price below €40/MWh on average.
- Demand stays high in the evening, when solar is gone, and pulls the price above €140/MWh.
- The spread is around €100/MWh and widening.
- Pumped-hydro already exploits this spread but is geographically limited (you need a mountain and a reservoir).
Batteries do the same thing as pumped-hydro, without the geography constraint. The opportunity sits at three different levels:
- Producer side. Solar farms with co-located batteries can shift their output to evening hours and capture €100+/MWh instead of €25. New solar project economics increasingly depend on this.
- Grid side. Standalone utility-scale storage acts as pure arbitrage and provides frequency regulation. This is the model that startups like Voltfang (second-life EV cells for stationary storage) and projects like the Flexbase redox-flow battery in Switzerland are building out, increasingly with private capital rather than public subsidies.
- Consumer side. Home batteries, bidirectional EV charging, and behind-the-meter storage in industry. Anyone who can shift their consumption from 18:00 to noon, or store solar locally and use it in the evening, participates in the same arbitrage.
If enough of this storage gets built, the result is the same in all three cases: solar generation is shifted into the evening, the duck-curve flattens, and the spread closes.
What’s next
This article only covers the wholesale market. The wholesale price is roughly one-third of what a German consumer actually pays per kWh; the rest is grid fees, the EEG levy, concession fees, and taxes. The follow-up will add those components on top of the same dataset to show how much of the final retail price is generation cost, how much is infrastructure, and how much is policy.
The wholesale market is sending a clear signal that storage is undervalued. The interesting question for the follow-up is whether the retail price actually passes that signal through to the people who could act on it.